
Google Ads Landing Page Optimization Guide
Welcome back to Surfside PPC. Today, we're going to be going over landing page optimization. Basically, landing pages are an absolutely critical part of your Google Ads strategy. Here is exactly why: Google constantly evaluates your landing page's relevance, load speed, and mobile-friendliness to determine its overall quality. These factors directly impact your Quality Score, which completely controls your ad's cost and visibility. A better landing page experience means a much lower cost-per-click (CPC) and significantly higher ad rankings.
Key Takeaways for Your Campaigns:
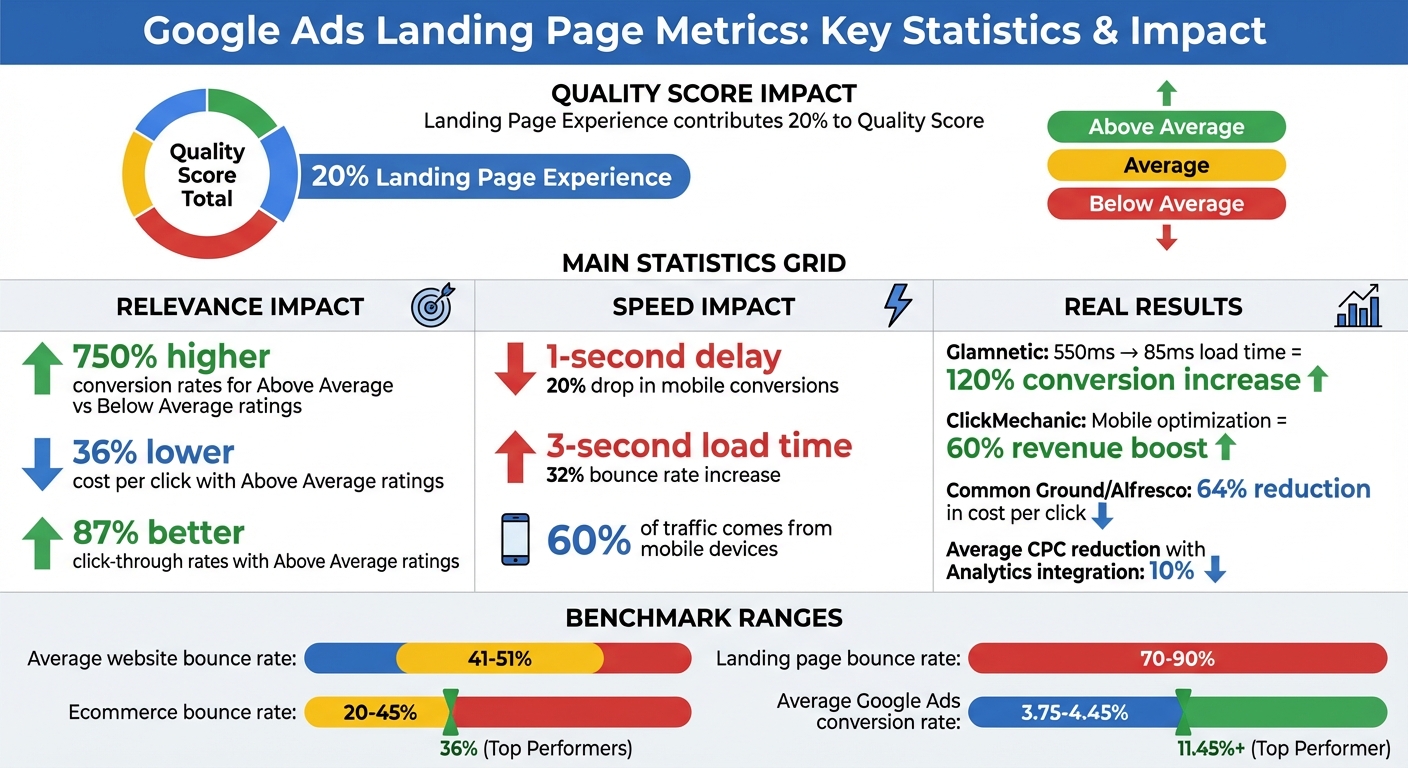
- Landing Page Experience: Google rates your page as "Above average", "Average", or "Below average." This rating makes up roughly 20% of your total Quality Score.
- Metrics That Matter: Focus heavily on relevance (your content must match the ad exactly), page load speed (faster pages always convert better), and mobile-friendliness (since over 60% of your traffic is going to be mobile).
- Performance Indicators: Bounce rate, average time on page, and your ultimate conversion rate reveal exactly how well your page actually engages your visitors.
- Improvement Tools: I highly recommend using the Google Ads "Landing pages" report combined with Google Analytics 4 to identify technical issues and optimize your performance.
Why it matters: Truthfully, a high-quality landing page doesn't just improve the user experience; it physically saves you money by reducing your CPC and increasing your conversions. When you are creating your campaigns, start by ensuring your page loads instantly, looks great on mobile devices, and delivers exactly what your ad copy promised.
Google Ads Landing Page Metrics Impact on Quality Score
Analyze Google Ads Landing Page Performance using GA4 & Custom Reports [Lesson 4]
sbb-itb-d8a1e45
Key Metrics Google Ads Uses to Grade Your Landing Pages
Google evaluates your landing pages using three main metrics to ensure they actually meet user expectations. Each metric contributes directly to your overall landing page experience rating. Here is exactly what you need to focus on.
1. Landing Page Relevance
Relevance is determined by how well your landing page content aligns with the user's search terms, your targeted keywords, and the promise you made in your ad. If someone searches for "Google Ads consulting", clicks your ad, and lands on a page offering general SEO services, that is a terrible user experience. Google will immediately mark it as irrelevant.
Getting this alignment right is incredibly profitable. Keywords rated "Above average" for both landing page experience and ad relevance see conversion rates up to 750% higher than those rated "Below average". You also enjoy 36% lower costs per click.
"The experience of a landing page is represented by the usefulness and relevance of information provided on the page, ease of navigation for the user, the number of links on the page, and the expectations users have based on the clicked ad creative." - Search Ads 360
To boost your relevance, keep your ad groups very tightly themed. Do not overload them with too many broad keyword variations. If your ad promotes a specific video course, the landing page should provide direct access to that exact course—not your website's homepage.
2. Page Load Speed and Core Web Vitals
How fast your page loads directly impacts your Quality Score. Google uses Core Web Vitals—Largest Contentful Paint (LCP), Interaction to Next Paint (INP), and Cumulative Layout Shift (CLS)—to grade your site. A 1-second delay on mobile pages can slash your conversions by 20%.
I always go into the Google Ads 'Landing pages' report (under Insights & reports) and review metrics like "Mobile-friendly click rate." If your mobile-friendly click rate is below 100%, you have technical issues that you need to fix immediately. Simplify your pages, compress your images, and remove heavy, unnecessary code.
3. Mobile-Friendliness
With roughly 60% of online traffic coming from mobile devices today, optimizing for mobile is absolutely mandatory. A poor mobile experience will completely drag down your Quality Score and your Ad Rank.
Look at Glamnetic as an example. Their slow mobile load times were killing their conversions. By switching to Nostra AI's Edge Delivery Engine, they cut their site response time down to 85ms and saw a 120% increase in conversions.
"With 60% of online traffic now coming from mobile, ensuring mobile-friendliness is a must-have requirement for improving the landing page experience." - Rand Owens, VP of Marketing, Nostra AI
Always aim for a 100% mobile-friendly click rate. Use single-column layouts, use large fonts, and put your primary call-to-action (CTA) right at the top of the screen so users don't have to scroll to find it.
Performance Metrics That Actually Show Landing Page Success
Beyond Google's technical grades, you really need to understand how users actually interact with your page. Metrics like bounce rate, average time on page, and your conversion rate show you exactly how engaging your content is.
Bounce Rate
The bounce rate measures the percentage of visitors who leave your page without doing anything. In Google Analytics 4, a session is considered "engaged" if it lasts more than 10 seconds or triggers a conversion event. If neither happens, it’s a bounce.
A high bounce rate usually means your landing page completely failed to meet the user's expectations. While it doesn’t directly calculate into your Quality Score, Microsoft Advertising and Google both note that users immediately leaving a page signals a very poor user experience.
To fix a high bounce rate, make sure your landing page headline perfectly matches your ad headline. You can also use engagement techniques like "Bucket Brigades" (short, punchy lines like "Here’s the deal:") to keep people reading.
Average Time on Page
Average time on page tells you how long visitors actually stay engaged. The longer visitors stay, the more likely they are to eventually convert.
"Quite simply, the more time people are spending on your website, the more they are reading, looking through your website pages, and getting value from the content you are producing."
- Ben Barnes, SEO and Search Marketing Specialist, Neural Edge
To increase time on page, break your text up into small, readable paragraphs, use bullet points, and make sure your page is a natural extension of your ad copy.
Conversion Rate
Your conversion rate is the ultimate measure of success. It’s calculated by dividing your total conversions by your total ad interactions. This metric tells you if your landing page is actually making you money.
The average conversion rate for Google Ads hovers around 3.75% to 4.45%, but highly optimized landing pages can easily clear 10%. To boost yours, use incredibly clear calls-to-action, explicitly highlight your unique selling points, and remove any friction from your lead forms.
How to Use Google Ads & GA4 to Improve Landing Pages
Google provides excellent free tools to help you analyze this data. Combining the "Landing pages" report with GA4 is exactly how I audit all my clients' accounts.
Using the Google Ads "Landing pages" Report
Go to Campaigns > Insights & Reports > Landing pages in your Google Ads dashboard. This report consolidates data from your Search, Display, Video, and Shopping campaigns so you can see exactly how each URL performs.
Watch your Mobile-friendly click rate closely. If it is below 100%, click the "Test" link to open Google's diagnostic tool and fix the errors.
"One of the best and easiest ways to get better results from your mobile ads is to improve the speed of your landing pages." - Google Ads Help
You will also see a Landing Page Experience status column rated "Above average", "Average", or "Below average". If a high-spend page says "Below average", that is the very first thing you need to fix today.
Connecting Google Ads with Google Analytics
Integrating Google Ads with Google Analytics 4 offers a much deeper look into actual user behavior. In Analytics, go to Admin > Google Ads Links, select your account, and click Link. Make absolutely sure Auto-Tagging is enabled.
Once linked, you can import key conversion events from Analytics back into Google Ads to optimize your Smart Bidding strategies based on actual landing page performance.
Conclusion
So, we'll wrap up the module here. Basically, landing page metrics dictate your entire Google Ads performance. Because they make up roughly 20% of your Quality Score, optimizing these pages will drastically lower your cost-per-click. When Common Ground revamped their client Alfresco's account with better landing pages, they literally saw a 64% reduction in CPC.
Track your data regularly. Landing page experience is a lagging indicator, meaning it takes time for Google to process your optimizations. Consistently review your Landing Pages report, fix your mobile usability errors, and make sure your ad copy perfectly aligns with your landing page headlines. If you do this, you will maximize the return on every single ad dollar.
FAQs
Why does landing page relevance matter for my Google Ads Quality Score?
So, landing page relevance matters because it basically proves to Google that you are actually delivering on the exact promise you made in your ad. When your landing page closely aligns with the user's search intent and your keywords, Google rewards you with a higher Quality Score. Truthfully, this directly results in a lower cost-per-click (CPC) and much better ad placements without you having to manually raise your bids.
What are the best ways to improve my landing page speed and mobile usability?
The absolute best way to start is by checking the Landing pages report in your Google Ads account to see your Mobile-friendly click rate. To physically speed up the page, you need to compress all your images, remove heavy unused JavaScript, and enable browser caching. I also highly recommend using a Content Delivery Network (CDN) to serve your site faster. For mobile usability, ensure you are using a single-column layout, large fonts, and easily tappable buttons so mobile users don't get frustrated and instantly bounce.
How can I lower my bounce rate and improve conversions on my landing pages?
To lower your bounce rate, your landing page headline must match your ad copy word-for-word. If there is a disconnect, users are going to leave immediately. Next, focus heavily on speed—if your page takes longer than 3 seconds to load, your bounce rate will skyrocket.
To improve conversions, keep your design incredibly clean and limit all distractions. I always remove the top navigation menu so users are forced to focus on your main call-to-action. Keep your lead forms short and only ask for essential information. If you need help executing this, Surfside PPC offers professional landing page audits and conversion rate consulting to get your campaigns highly profitable.
0 comments