
Running Google Ads without testing can waste your budget. A/B testing, known as "Experiments" in Google Ads, helps you compare two campaign versions - original and modified - side-by-side. This process identifies what works best, whether it’s ad copy, bidding strategies, or landing pages. Here's how you can use A/B testing to improve your campaigns:
- What to Test: Headlines, calls-to-action, landing pages, bidding strategies, and audience targeting.
- Why Test?: Boost click-through rates, conversions, and ROI while reducing wasted ad spend.
- How to Start: Use Google Ads’ built-in Experiments tool to split traffic evenly and analyze results after 4–6 weeks.
- Best Practices: Test one variable at a time, focus on a single metric, and avoid ending tests too early.
A/B testing ensures your decisions are data-driven, helping you refine campaigns and achieve better performance.
How to Run A/B Tests in Google Ads for More Sales (5 Winning Ideas)
sbb-itb-d8a1e45
Set Your A/B Testing Goals and Hypothesis
Before diving into A/B testing, it’s crucial to define the decision your test will help you make. A clear goal ensures that your data leads to actionable insights. While Google Ads allows you to select up to two primary success metrics during experiment setup, focusing on a single primary metric from the start can simplify analysis and avoid confusion.
Make sure your primary metric aligns with what you're testing. For instance:
- Testing ad copy? Focus on conversion volume.
- Testing a landing page? Look at the conversion rate.
- Experimenting with bidding strategies? Use ROAS or cost-per-conversion as your metric.
Be cautious of the "CTR trap." A high click-through rate might look great, but it doesn’t always mean you’re driving quality traffic or achieving conversions.
When forming your hypothesis, structure it into three parts: the why (the problem), the how (the proposed solution), and the what (the expected result). For example: "Our 'Buy Now' call-to-action might intimidate first-time visitors. Replacing it with 'Learn More' could increase conversions by 15%." This approach connects the test to a business goal and sets a clear success benchmark. Google’s best practices emphasize this point:
Your hypothesis should reveal why you're running the experiment and should be tied to your business goal.
To ensure reliable results, test only one variable at a time. For example, don’t change both the headline and the bidding strategy in the same test - it makes it impossible to pinpoint which change influenced the outcome. Build your hypothesis on actual data - use tools like Google Analytics, heat maps, or past campaign performance, rather than relying on assumptions or guesses.
Finally, establish clear guardrails for your test. Decide on a traffic split (e.g., 50/50 or 70/30), set your budget, and plan to run the test for 2–4 weeks. Reliable results require at least 100 data points - or 50 conversions for Demand Gen campaigns. Avoid ending tests too early, as this often leads to "false winners" that don’t hold up over time. With well-defined goals and a structured hypothesis, you’ll be ready to identify which campaign elements to test next.
What to Test in Google Ads Campaigns
Google Ads A/B Testing Variables: What to Test and Best Strategies
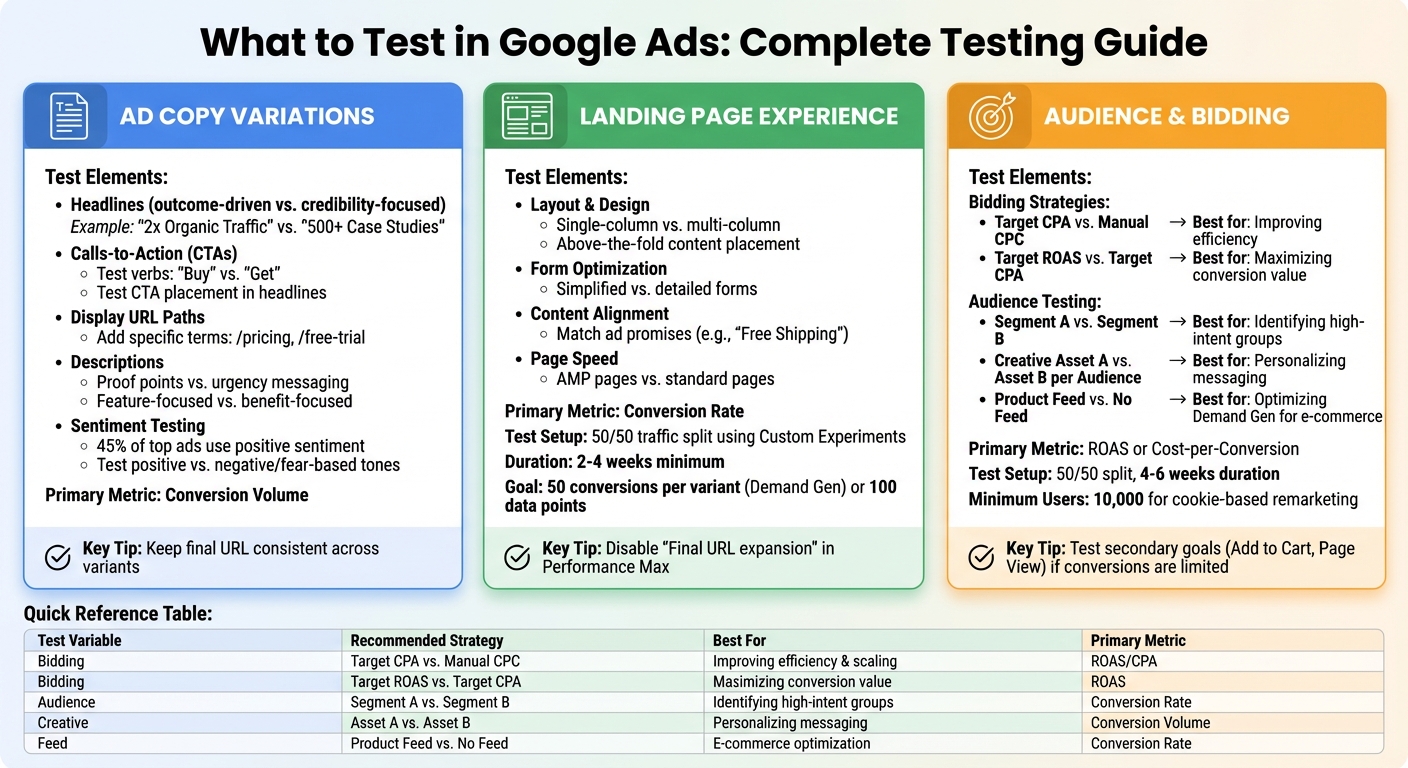
Once you've set your goals and outlined your hypothesis, focus on three key elements: ad copy, landing pages, and audience/bidding strategies. Each plays a unique role in the customer journey, so prioritize based on where you notice the biggest performance gaps.
Ad Copy Variations
Your ad copy is the first thing users interact with, so even small tweaks can have a noticeable impact on click-through rates (CTR) and conversions. Start by experimenting with headlines. For example, compare outcome-driven phrases like "2x Organic Traffic" with credibility-focused ones such as "500+ Case Studies". Testing different calls-to-action (CTAs) is another smart move - swap verbs like "Buy" and "Get" or adjust their placement in headlines to see what grabs attention.
You can also test display URL paths by adding specific terms like "/pricing" or "/free-trial" to give users a clearer idea of what to expect, which can improve CTR. For descriptions, try contrasting proof points with urgency-based messaging, or compare feature-focused copy ("what the product does") against benefit-focused copy ("how it improves life"). Interestingly, research analyzing over 600 top-performing ads found that 45% leaned on positive sentiment, but testing negative or fear-based tones against positive ones can help you uncover what resonates most with your audience.
If you're using Responsive Search Ads (RSAs), leverage asset pinning to lock specific headlines or descriptions into certain positions. To ensure accurate results, keep the final URL consistent across all ad variants so changes in performance reflect the copy alone, not the landing page.
Once you've optimized your ad copy, turn your attention to the landing page experience.
Landing Page Experience
Your landing page experience is a crucial factor influencing your Quality Score. Testing different layouts, content strategies, and CTAs can significantly impact conversion rates, cost per conversion, and return on ad spend (ROAS). A good starting point is to focus on reducing friction - this could mean moving essential information above the fold, simplifying forms, or comparing single-column layouts to multi-column designs.
Aligning your landing page content with the promises made in your ads (like "Free Shipping") can help reduce bounce rates and improve user engagement. You might also want to test AMP pages against standard ones to see if faster load times reduce abandonment and increase conversions.
For clean testing, use Custom Experiments in Google Ads to split traffic evenly (50/50) between page variants. Avoid comparing a generic homepage to a specific service page since that’s more about intent than design. If you're running Performance Max campaigns, disable "Final URL expansion" during tests to ensure traffic doesn't get redirected to unintended pages. Run these experiments for at least 2 to 4 weeks and aim for 50 conversions per variant in Demand Gen campaigns or 100 data points for conversion-based metrics.
With landing pages optimized, the next step is refining your audience targeting and bidding approach.
Audience Targeting and Bidding Strategies
Testing bidding strategies can reveal whether automation outperforms manual CPC. For instance, compare automated strategies like Target CPA with manual CPC to see if automation boosts efficiency. Already using Smart Bidding? Test different goals, such as Target ROAS versus Target CPA, to figure out which delivers higher conversion value for your business.
You can also experiment with new audience lists and tailored creative assets to find high-intent customer segments. In Demand Gen campaigns, testing "Product Feed" against "No Product Feed" can help optimize results for visually driven or shopping-focused campaigns.
To get reliable results, split traffic evenly (50/50) and run tests for 4 to 6 weeks. If conversions are limited, test secondary goals like "Add to Cart" or "Page View" instead. For remarketing campaigns using cookie-based splits, ensure you have at least 10,000 users for accuracy.
| Test Variable | Recommended Strategy | Best For |
|---|---|---|
| Bidding | Target CPA vs. Manual CPC | Improving efficiency and scaling |
| Bidding | Target ROAS vs. Target CPA | Maximizing conversion value/revenue |
| Audience | Segment A vs. Segment B | Identifying high-intent groups |
| Creative | Asset A vs. Asset B per Audience | Personalizing messaging for segments |
| Feed | Product Feed vs. No Feed | Optimizing Demand Gen for e-commerce |
How to Set Up A/B Tests Using Google Ads Experiments
Now that you’ve identified what to test, it’s time to dive into the Google Ads Experiments feature. This tool allows you to create a trial campaign alongside your original one, enabling a side-by-side comparison without disrupting your active ads. Follow these steps to set up your experiment effectively.
Access Experiments and Create a Custom Experiment
Start by heading to the Campaigns tab and selecting Experiments. On the "All Experiments" page, click the plus sign at the top of the table, then choose Custom > Custom experiment. This feature supports campaigns for Search, Display, Video, and Hotel Ads, but it doesn’t work with Shopping or App campaigns.
Before proceeding, make sure to remove any outdated ad formats, like Text Ads or Expanded Text Ads, from your base campaign. These older formats can’t be used in new experiments and will cause issues during setup.
Select Base Campaign and Configure Test Variants
Choose the campaign you want to test as your "base campaign." Google will automatically create a trial campaign with a suffix added for easy identification. You can also pick up to two success metrics - such as "Clicks" or "Increase" - to highlight in your performance reports.
Next, configure the specific changes you plan to test. For example, you might switch from manual CPC to Target CPA, tweak ad headlines using the "Find and replace" tool, or test different landing pages by updating URLs. To ensure accurate results, test only ONE variable at a time.
Set Traffic Allocation, Budget, and Schedule
For the best comparison, Google recommends a 50% traffic split between your original and experiment campaigns. You can choose between two traffic allocation methods:
- Cookie-based: Assigns users consistently to one version.
-
Search-based: Randomizes the version shown per search.
Cookie-based is generally preferred for consistency, but search-based can reach statistical significance faster, though it may show users both versions.
Your experiment will share the budget with your original campaign, using either a "Budget Split" (for Search, App, and Display campaigns) or a "Traffic Split" (for Performance Max, Demand Gen, and Video campaigns). Plan to run the experiment for 4 to 6 weeks to gather enough data. Set the start date a few days in advance to allow time for ad review.
"Thanks to this feature we're able to test various landing pages and ads, so we can improve our performance." - Gabi Vatmakhter, Senior PPC Specialist, Fiverr
Once your experiment is live, avoid making changes to the base campaign, as this could skew your results. If updates are unavoidable, enable the "sync" feature to ensure consistency between the original and experimental campaigns. With everything in place, your experiment will deliver actionable insights to help fine-tune your campaign’s performance.
Analyze A/B Test Results and Apply Changes
Once you've gathered your data, the next step is to analyze it and pinpoint the winning variant. Google Ads provides visual indicators and statistical tools to help, but knowing which details to prioritize - and which to set aside - can make all the difference in making sound decisions.
How to Read Key Metrics
The focus should remain on the primary metric you chose when setting up the test. This could be Click-through Rate (CTR), Conversion Rate, Cost-per-conversion (CPA), or Cost-per-click (CPC). In the results table, green values highlight better-performing variants, while red signals weaker performance.
Keep an eye on status labels like "One arm is better" for a clear winner or "Similar performance" if no significant difference is found. The results will often include a confidence interval (e.g., [2.5% to 4.2%]), which shows the range within which the actual performance difference likely falls.
| Metric | Threshold | Success Indicator |
|---|---|---|
| Click-through Rate (CTR) | No minimum required | Highest percentage |
| Conversion Rate | ≥ 100 conversions | Highest percentage |
| Cost-per-click (CPC) | No minimum required | Lowest cost |
| Cost-per-conversion (CPA) | ≥ 100 conversions | Lowest cost |
Understanding these metrics will help you interpret the results and move forward confidently.
Make Data-Driven Decisions
Always wait until you reach at least 95% confidence before finalizing your test results. Once you've identified a winner, you have two options: apply the changes to the base campaign (to retain historical data) or create a new campaign if the changes require a more significant overhaul.
Before rolling out updates, double-check for external influences like seasonality, holidays, or technical issues that might have skewed the data. To calculate the performance improvement, use this formula:
(Variant Metric - Original Metric) / Original Metric × 100
For example, if the original CTR was 3.2% and the variant achieved 4.1%, that's roughly a 28.1% improvement. After implementing the changes, continue monitoring the key metrics to ensure the improvement holds steady and isn’t just a short-term spike. These insights can then inform updates to ad copy, landing pages, or bidding strategies, keeping your A/B testing process aligned with your overall campaign goals.
Best Practices and Common Mistakes for Google Ads A/B Testing
Best Practices for A/B Testing
When conducting A/B tests in Google Ads, it's crucial to focus on one variable at a time. Whether you're tweaking a headline, experimenting with a bidding strategy, or trying out a new landing page, isolating a single element ensures you can directly connect performance changes to that specific variable. Testing multiple elements at once makes it nearly impossible to pinpoint what caused any shifts in results.
Run your tests for 4–6 weeks to account for conversion delays and weekly performance variations. It's also a good idea to ignore the first seven days of data, as this is typically the "ramp-up" period where Google's algorithm adjusts to changes. For accurate comparisons, split traffic evenly - 50/50 - between your control and test groups. Before starting, decide on a primary metric to measure success, like conversion rate or cost-per-acquisition. Avoid relying on vanity metrics like click-through rate, which can be misleading.
"Testing is not about being clever. It is about being honest."
- Aditya Pandey, Publisher, CausalFunnel
Consistency is key. Keep your campaign conditions stable throughout the test. Adjustments to budgets or bids mid-test can reset the algorithm's learning phase, skewing results. Only test when your conversion tracking is reliable, your campaigns have steady traffic, and any automated bidding strategies have completed their learning period. Also, avoid testing during major seasonal events like Black Friday, as these can create data spikes that distort your findings.
By sticking to these practices, you set the stage for meaningful and reliable test results.
Common Mistakes to Avoid
One of the most common mistakes in A/B testing is drawing conclusions too early. To ensure your findings are statistically valid, aim for at least 100 conversions per variant at a 95% confidence level. Ending tests prematurely - after just a few days - often captures short-term fluctuations rather than meaningful trends. Similarly, running tests during seasonal peaks or promotional periods can lead to decisions based on external factors rather than the variable you're testing.
"Avoid testing when entering a known low or high period of time for your product or service since you may be making decisions based on wrong data influenced by externalities."
- Fernando D'Annunzio, Google Ads Strategy & Technical Management
Another pitfall is focusing solely on low-cost conversions without considering lead quality. A successful test should not only reduce costs but also maintain or improve the overall value of your leads. If you're using Google's auto-apply feature, let the test run its full course instead of making changes mid-way. Additionally, ensure the base campaign remains unchanged during the test to avoid introducing unnecessary variables.
Conclusion
Key Takeaways
To truly understand what drives performance in your campaigns, focus on isolating one variable at a time - whether that’s a headline, bidding strategy, or landing page. Tools like Google Ads Experiments make this process easier by splitting traffic evenly, ensuring consistent auction conditions, and tracking key metrics like conversion rate, cost-per-acquisition, and return on ad spend.
For businesses that embrace A/B testing, the rewards can be substantial. On average, companies see conversion rates improve by 15–20% through proper testing. These incremental gains, when compounded over time, can significantly enhance your ROI. Keep in mind, though, that meaningful results require patience - allow a few weeks for data collection and ensure you have enough conversion points to draw accurate conclusions.
"Your Google Ads theories are only as good as the data that backs them up." - Grow My Ads
Take these insights and apply them to your campaigns to drive better outcomes.
Next Steps
Begin your optimization journey by identifying a high-impact element to test. Develop a clear, goal-oriented hypothesis and set up your first experiment using the Google Ads Experiments page. To ensure meaningful results, allocate 5–10% of your total ad budget specifically for testing, and don’t forget to document your findings for future reference.
If you’re unsure where to start or need expert advice, Surfside PPC offers Google Ads management services and consulting sessions. Their team can guide you through building a structured A/B testing strategy that aligns with your goals and helps you maximize ROI. Whether you’re just beginning with experiments or looking to refine your approach, professional support can make a significant difference in achieving stronger campaign performance.
FAQs
How do I know if my A/B test has enough data to be trustworthy?
Your A/B test becomes reliable when it achieves statistical significance, usually at a 95% confidence level, and gathers enough data to reduce variability. Tools like the Google Ads Experiments page can help track results and confirm you've collected sufficient data for dependable conclusions. Reaching statistical significance ensures any performance differences are meaningful, allowing you to make well-informed decisions based on your test outcomes.
When should I use cookie-based vs. search-based traffic splits?
When it comes to dividing traffic for testing, there are two main approaches to consider: cookie-based traffic splits and search-based traffic splits.
With cookie-based traffic splits, users are assigned permanently to either a test or control group. This ensures they have the same experience every time they visit. It's a great choice for tests that target specific audiences or focus on landing pages, where consistency is key.
On the other hand, search-based traffic splits are more suited for campaigns with lower traffic or when you need to align with previous search-based tests. In this setup, user assignments are re-evaluated with each search, meaning users might experience both the test and control conditions over time. This flexibility can be helpful for gathering broader insights.
What should I do if my test improves CTR but hurts conversions?
If your A/B test shows an increase in click-through rate (CTR) but a drop in conversions, it's time to dig into the details of what you tested. A higher CTR often indicates that your ad is grabbing attention. But if conversions are falling, it could mean the landing page or offer isn't delivering what users expected.
To fix this, start by reviewing the consistency between your ad and landing page. Does the messaging align? Next, consider tweaking your offers or calls-to-action (CTAs) to better match what users are looking for. Finally, test different landing page elements - like headlines, images, or forms - to see what resonates. Keep a close eye on your metrics to pinpoint where users are dropping off and make adjustments accordingly.
0 comments