
Underperforming products in Google Shopping campaigns waste your ad budget without delivering results. The key to improving your Return on Ad Spend (ROAS) is identifying these low performers and reallocating your budget to products that convert better. Here’s a quick guide to help you:
- Metrics to Watch: Focus on Click-Through Rate (CTR), Conversion Rate, ROAS, and Search Lost IS (Rank). Low CTR often signals unappealing ads, while low Conversion Rates point to landing page issues.
- Access Data: Use Google Ads' Products page or predefined Shopping reports to track performance metrics like clicks, conversions, and ROAS.
- Segment and Filter: Break down data by time, device, or network. Apply filters (e.g., high spend, zero conversions) to pinpoint problem products.
- External Factors: Address pricing errors, seasonality, or feed quality issues like missing attributes or poor images.
- Review Regularly: Analyze performance over 30, 60, and 90 days to spot trends and exclude persistent low performers.
The RIGHT Way to Optimize Google Shopping Campaigns | Step-by-Step Tutorial
How to Access and Analyze Product Performance Data
Being able to quickly locate and examine performance data is key to identifying products that might not be meeting expectations.
Finding Shopping Campaign Reports
To dive into product performance, start by accessing the Products page in Google Ads. Here's how: click the Campaigns icon and select Products from the menu. Use the Workspace filter to toggle between Shopping and Performance Max campaigns. This page provides essential details like Item ID, product title, price, clicks, conversions, and product status for every item in your feed.
"The Products page helps you understand the performance of individual products in your campaign." - Google Ads Help
If you need a broader view across multiple campaigns, head to Insights and reports > Report editor > Predefined reports > Shopping, and select Item ID. This will display a detailed list of all products along with their performance metrics. Just remember, it can take 24–48 hours for updates from Merchant Center to sync with Google Ads reporting.
Once you have the basic report, you can segment the data further to uncover patterns and trends.
Segmenting Data by Performance Metrics
When you're viewing product data, use the Columns icon to add metrics like ROAS, conversion value per cost, and absolute top impression share. This gives you a more comprehensive view of performance indicators. To dig deeper, click the Segment icon to break down data by time (day, week, month), device, or network. For example, segmenting by device can help you spot performance gaps that might point to landing page or image issues.
If certain products aren't showing up in your reports, check the Product diagnostics column for errors or confirm that they aren't flagged as "Excluded" in your product groups.
Using Key Metrics to Identify Underperforming Products
Key Metrics to Identify Underperforming Products in Google Shopping Ads
Once you’ve accessed your product data, the next step is to dive into the key metrics that can reveal performance issues. One critical metric is CTR (Click-Through Rate), which measures how often users click your ad after seeing it. The formula is simple: (Clicks ÷ Impressions) x 100. A low CTR often points to problems like an unappealing title, subpar images, or uncompetitive pricing. Google Ads even provides Benchmark CTR data, which lets you compare your product’s performance to similar items in the same auctions - a handy way to gauge competitiveness.
Another essential metric is the conversion rate, which tells you how many clicks actually result in sales. If you notice a high CTR but a low conversion rate, it’s usually a sign of a landing page issue. For example, the advertised price might not match the price on your site, or the product could be out of stock.
"A high CTR with a low Conversion Rate points to a landing page issue".
Products that chew through your budget with lots of clicks but few conversions over 30, 60, or 90 days are prime candidates for either exclusion or serious adjustments. By analyzing CTR and conversion rates together, you can better understand both the appeal of your ads and their effectiveness at driving sales.
CTR and Conversion Rates
When digging into these metrics, patterns often emerge that explain why a product isn’t performing. If your CTR falls below your account average or the benchmark, it’s time to revisit your product titles, improve your images, or check if your pricing stacks up against competitors. On the other hand, if conversion rates are lagging, ensure your pricing is consistent across ads and landing pages, and double-check the accuracy of your Merchant Center feed.
Another metric to watch is Search Lost IS (Rank). If this number hits 80% or higher, it means your products are losing visibility - not just due to low bids, but potentially because of poor feed quality or weak historical performance.
While CTR and conversion rates focus on ad appeal and traffic quality, ROAS (Return on Ad Spend) provides a clearer picture of profitability.
ROAS Analysis
To determine if a product is profitable, calculate its break-even ROAS by factoring in COGS (Cost of Goods Sold) and shipping. Products performing below this threshold are losing money. For instance, high-margin items might succeed with a ROAS of 150-200%, whereas low-margin products in retail may require 800% or more to turn a profit.
Shopping campaigns typically demand higher ROAS thresholds (400-500%) compared to Search campaigns (300%) because shoppers already see the price and image before clicking - indicating stronger purchase intent. Interestingly, an extremely high ROAS (e.g., 2000%) can also signal a missed opportunity. Such a number might mean you’re under-spending and leaving growth potential on the table.
To spot trends, review performance over 30, 60, and 90-day windows. This helps identify products that consistently drain your budget without delivering enough value.
Analyzing Performance Over Time
Tracking metrics over different timeframes helps you distinguish between temporary dips and persistent underperformance. For example, a product might struggle during a specific week due to stock issues or a pricing error but perform well over several months. By reviewing data across 30, 60, and 90 days, you can separate seasonal trends from long-term problems.
Google’s ad auctions consider historical performance alongside over 200 other signals when ranking products. Monitoring these trends over time helps you determine whether declining visibility stems from recent changes or deeper, ongoing issues. Shorter timeframes are great for evaluating the impact of promotions, while longer periods can highlight products that are steadily losing ground.
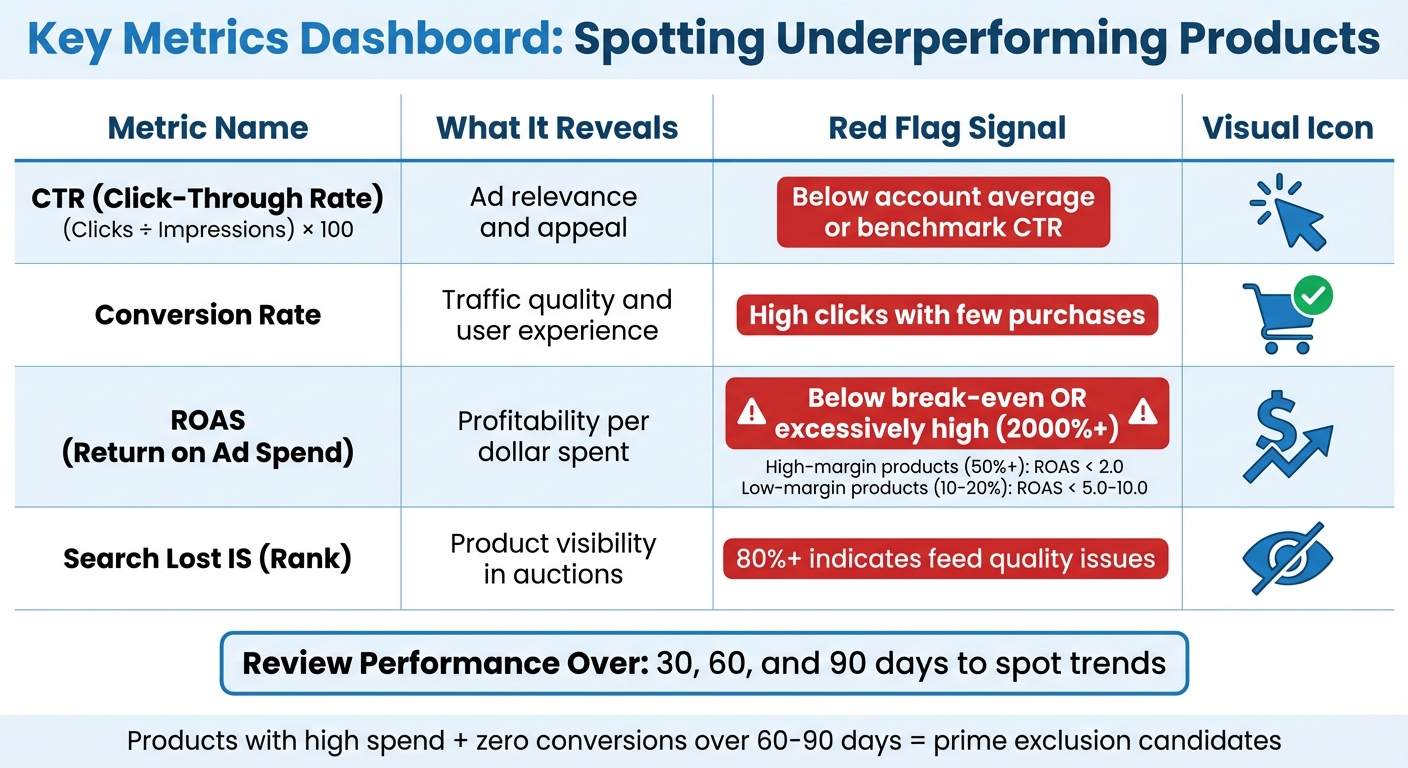
| Metric | What It Reveals | Red Flag Signal |
|---|---|---|
| CTR | Ad relevance and appeal | Below account average or benchmark CTR |
| Conversion Rate | Traffic quality and user experience | High clicks with few purchases |
| ROAS | Profitability per dollar spent | Below break-even or excessively high (2000%+) |
| Search Lost IS (Rank) | Product visibility in auctions | 80%+ indicates feed quality issues |
sbb-itb-d8a1e45
Filtering and Troubleshooting Underperforming Products
Once you've identified the key metrics to monitor, the next step is to isolate products that drain your budget. Google Ads provides powerful filtering tools to help you pinpoint these underperforming items.
Applying Filters in Google Ads
Head over to the Products tab within your Shopping campaign to start applying filters. These filters allow you to set specific conditions, and since Google Ads uses "AND" logic, only products meeting all your criteria will appear in the results.
For instance, you can filter for products with Cost > $50 and Conversions = 0 to uncover those that consume your budget without delivering results. Similarly, a filter for CTR < 1% can highlight products that show up in searches but fail to generate clicks.
Other useful filters include Approval Status = Disapproved or Status = Not triggering ads: critical issues, which can reveal items blocked due to feed errors or pricing mismatches. To spot trends where performance lags behind growing demand, the Merchant Center's Product Category Insights can be a valuable tool. If you're short on time, Merchant Center's AI-powered filtering feature lets you use natural language queries like "Find visible products that have zero clicks" or "Which products cost me clicks but are out of stock?".
After refining your filters, it’s time to shift your focus to external factors that might also be impacting performance.
Checking External Factors
While Google Ads filters help you identify internal issues, external factors like pricing and seasonality can also influence product performance. For example, ensure that the prices in your product feed match those on your landing pages. Price mismatches can lead to disapprovals and hurt your competitiveness.
Seasonality and weather are equally important. Products like umbrellas, winter coats, or inflatable pools naturally see demand spikes or drops based on the time of year or local weather conditions. If your campaign timing doesn’t align with these trends, performance could suffer. Regularly check your Merchant Center Diagnostics for issues like "Preemptive Item Disapproval", which flags inconsistencies between your feed and website, such as pricing or availability mismatches. Additionally, missing required attributes like GTIN, brand, color, or size can limit a product’s visibility or even lead to account suspension. Keep in mind that once you update product data to address warnings, Google typically takes 3–5 business days to review and apply the changes.
Using the Search Terms Report
To dig deeper into performance issues, review the Search Terms Report. This report shows the actual search queries triggering your product ads, making it an excellent tool for identifying irrelevant traffic. Since Shopping ads don’t rely on keywords, Google uses your product data (titles and descriptions) to match user queries. If a product gets clicks but no conversions, irrelevant query matches may be the culprit - like ads for unrelated products being triggered by terms such as "wine glasses".
For a broader perspective, the Search Terms Insights tool can group queries into intent-based categories, using data from the past 56 days. This helps you identify whether underperformance is due to products showing up for the wrong customer intent without requiring you to manually review every query. Once you spot irrelevant queries, add them as negative keywords to reduce wasted spend. Additionally, you can use high-performing search categories from these insights to update your product titles and attributes in Merchant Center, improving relevance and boosting performance.
Creating a Review and Optimization Process
Setting Performance Benchmarks
Establish clear performance thresholds to guide your actions. For instance, flag products with significant ad spend but no conversions over 60 days, or those with a ROAS below 2.0 for high-margin products (50%+ margin). For products with lower margins (10–20%), aim for a ROAS between 5.0 and 10.0 to maintain profitability.
Use historical data trends to set these benchmarks effectively. Analyze performance over 30-, 60-, and 90-day periods to distinguish short-term fluctuations from long-term problems. A product underperforming for just seven days might be experiencing a seasonal dip, but consistent poor results over 90 days indicate a deeper issue. Keep detailed records of every exclusion or bid adjustment to refine your criteria over time. Employ custom labels in your product feed (e.g., "low_performer" or "pause_candidate") to manage underperforming items without removing them from campaigns entirely.
| Review Frequency | Recommended Phase | Key Focus Area |
|---|---|---|
| Weekly | Optimization / Launch | Spotting immediate problem areas ("bleeders") and identifying high-potential winners. |
| Monthly | Maintenance | Adjusting bids based on ROAS targets and profit margins. |
| Quarterly | Strategic Review | Evaluating product categories, seasonality, and long-term market trends. |
Once benchmarks are in place, set a systematic review schedule to monitor and refine product performance.
Scheduling Regular Performance Reviews
Adapt your review schedule based on your campaign's current phase. During the initial optimization phase, run weekly performance reports to catch sudden changes - like a 50% drop in sales for a top-performing product or technical feed errors. After your campaign stabilizes, transition to monthly reviews for ongoing adjustments and quarterly reviews for more strategic evaluations.
Leverage tools like Google Ads to automate daily, weekly, or monthly performance reports. Complement these with Google Analytics dashboards to track metrics such as CTR, ROAS, conversion rates, cart-to-detail rates, and buy-to-detail rates automatically. During each review, use the Auction Insights report to monitor competitors’ actions, such as pricing changes or increased impression shares, which might explain sudden performance dips.
Finally, account for learning phases - when you tweak bid strategies or reactivate paused products, allow Google Ads several days to complete its learning process before drawing conclusions.
Conclusion
Keep a close eye on performance metrics and rely on data to identify underperforming products. Pay special attention to items with high spend but no conversions, a click-through rate (CTR) under 0.5%, or a return on ad spend (ROAS) that doesn’t meet your profitability benchmarks. For high-margin products (50%+), this is typically below 2.0, while for low-margin items, it tends to fall below 5.0–10.0. Analyzing performance over 30-, 60-, and 90-day periods can help you differentiate between short-term dips and more persistent issues.
Before deciding to exclude a product, check for simple fixes like disapprovals, pricing errors, or seasonal trends. You might be able to revive performance by refining keywords, updating images to 800x800 pixels or larger, or adjusting bids.
"Knowing when and how to exclude [underperforming products] is one of the most underrated levers in campaign profitability." - Define Digital Academy
Instead of outright deleting low performers, use custom labels to flag them, allowing you to revisit and test them later if market conditions improve. During the optimization phase, weekly reviews are essential to catch sudden performance shifts. Once your campaigns stabilize, you can scale back to monthly or quarterly audits.
Ditch guesswork by setting clear performance thresholds and leveraging automated reporting. This approach not only keeps your product feed streamlined but also reallocates budget from underperforming products to those with greater potential. It helps you stay responsive to pricing changes and competitive shifts in real time. By making regular, data-backed adjustments, you can consistently boost your ROAS and enhance overall campaign results.
FAQs
What’s a “good” ROAS for my products?
A "good" ROAS (Return on Ad Spend) is generally considered to be around 400% (or 4:1). In other words, for every $1 spent on advertising, you should generate $4 in revenue. That said, this figure isn’t set in stone - it can shift depending on your industry and profit margins. The key is to align your ROAS targets with your specific business goals and the profitability of your products.
When should I exclude a product vs. fix it?
If a product consistently costs more than it generates or drains your budget without delivering conversions, it’s time to exclude it. This allows you to focus your resources on items that are actually profitable. On the other hand, if the problem is fixable - like data feed errors, policy violations, or poorly optimized attributes - work on resolving these issues. Fixing them can make the product eligible again and potentially boost its performance.
Why am I getting clicks but no sales?
If your Google Shopping ads are getting clicks but no sales, your product feed data might be the culprit. Make sure the details in your feed are complete and accurate - this includes specifics like color, size, and other key attributes. Another common issue is low relevance. This can happen if your ads are triggered by mismatched search terms or if your product listings aren't properly optimized. To fix this, regularly review your campaign performance and fine-tune your listings to improve relevance and drive more conversions.
0 comments