
Want to track your Google Ads performance effectively? Build an ROI dashboard. This guide shows you how to create a real-time ROI dashboard using Looker Studio, Google Ads, and GA4. Here's what you'll learn:
- Why ROI matters: ROI = (Revenue – Ad Spend) / Ad Spend. It helps you see which campaigns are profitable.
- Tools needed: Google Ads, GA4, Looker Studio (all free).
- Steps to set up: Link Google Ads and GA4, enable conversion tracking, and create visualizations in Looker Studio.
- Key features: Add filters, automate reports, and compare attribution models for deeper insights.
By the end, you'll have a dashboard that simplifies ad performance tracking, saves time, and helps optimize your ad spend.
Let’s dive in.
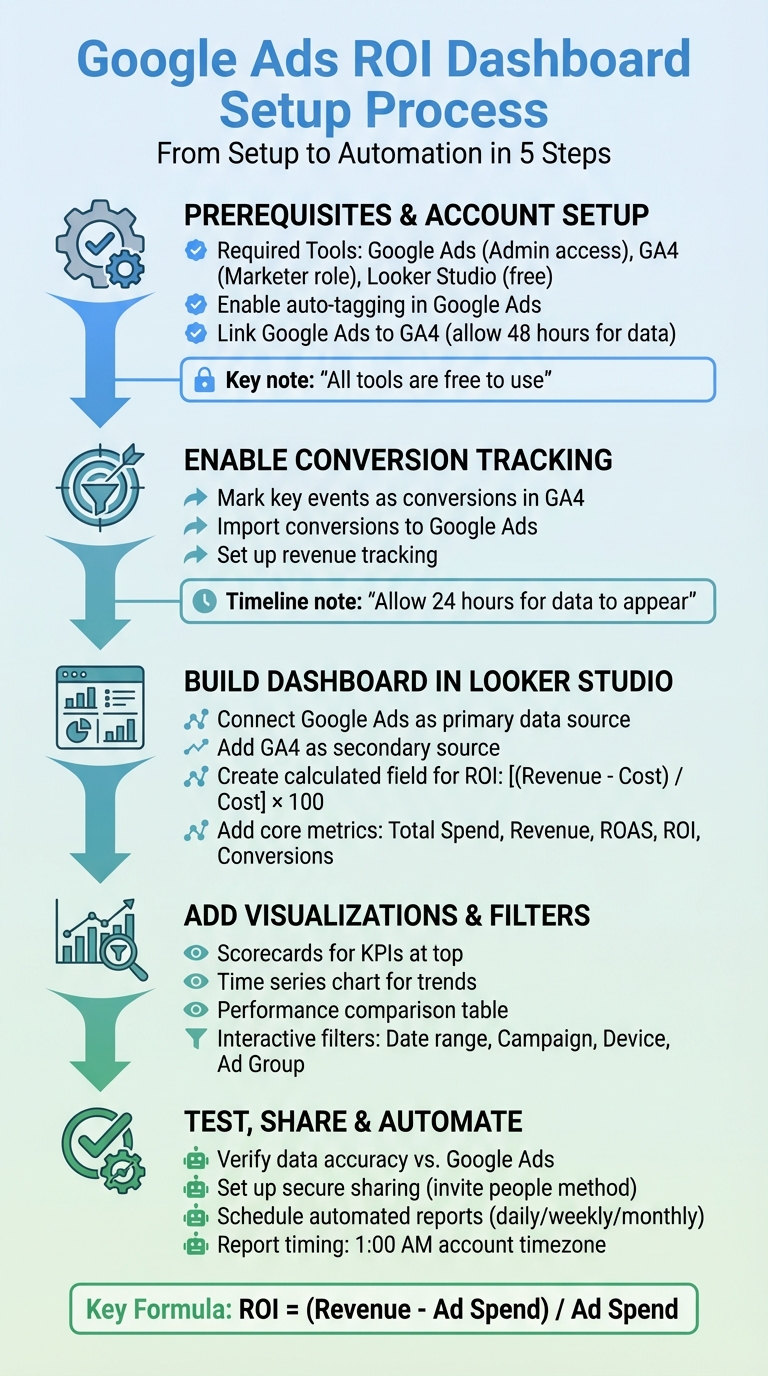
Google Ads ROI Dashboard Setup: 5-Step Implementation Process
📊 Track Your Google Ads ROI Directly in Google Analytics 4 (GA4)
sbb-itb-d8a1e45
What You Need Before Starting
To set up your dashboard, you'll need Google Ads, GA4, and Looker Studio. The good news? Looker Studio and its built-in connectors for Google Ads and GA4 are free to use. If you're pulling in data from non-Google sources, you'll need third-party connectors like Supermetrics or Porter Metrics.
Make sure you have the right permissions: Admin access in Google Ads and at least a Marketer role in GA4. These permissions allow you to link accounts and import conversion data. If you're working with a Manager Account (MCC), you can connect up to 50 sub-accounts per Looker Studio data source.
| Tool | Required Access Level | Primary Purpose for ROI Dashboard |
|---|---|---|
| Google Ads | Admin | Provides ad spend, clicks, impressions, and CPC data |
| GA4 | Marketer (for import) / Read & Analyze | Supplies conversion events, revenue, and user behavior data |
| Looker Studio | Standard Google Account | Used to visualize and blend data from Google Ads and GA4 |
Required Accounts and Access
Before diving in, confirm that your Google Ads and GA4 accounts are linked. Keep in mind that it can take up to 48 hours for data to appear in GA4 reports after linking. Also, ensure auto-tagging is enabled in Google Ads, and your website preserves the GCLID (Google Click Identifier) through redirects.
"To start importing data, you'll need to link your Google Ads account to a Google Analytics account and turn on auto-tagging in your Google Ads account." - Google Ads Help
Once your accounts are linked and tagging is set up, you can move on to setting up conversion tracking and importing revenue data.
Enable Conversion Tracking and Revenue Import
For accurate ROI calculations, you’ll need to track conversion events and import revenue data. In GA4, mark key events - like purchases, form submissions, or phone calls - as "conversions" before importing them into Google Ads. These events represent actions that bring value to your business.
"Google Analytics serves as the primary location for defining and managing your key events, which can then be imported as conversions into Google Ads." - Google Ads Help
After enabling tracking, only new conversion data will be imported into Google Ads. Note that it may take up to 24 hours for GA4 key event data to show up in Google Ads after the initial import. For actions that don’t have a direct monetary value, like email sign-ups, assign a KPI value to reflect their importance in your reports.
Lastly, keep in mind that Google Ads automatically converts GA4 revenue into your billing currency using average daily exchange rates.
How to Build Your ROI Dashboard
Link Google Ads and GA4
Start by logging into your GA4 account and navigating to Admin > Product Linking > Google Ads Linking. From there, select your Google Ads account and complete the linking process. Make sure at least one event is marked as a "key event" in GA4 to ensure performance data flows correctly.
Once linked, head to the Advertising tab in GA4 to confirm that metrics like ad cost and ROAS are appearing. This step ensures the connection between the two platforms is working as expected. Keep in mind that auto-tagging must remain enabled in Google Ads for this integration to function properly. Once you've verified everything, you're ready to move on to creating your report in Looker Studio.
Create a New Report in Looker Studio
Open Looker Studio and start with a blank report. Add Google Ads as your primary data source, using Overall Account Fields to ensure smooth integration of dimensions and metrics. Then, link GA4 as a secondary source, making sure it has Read & Analyze permissions.
If you plan to share the dashboard with others who don't have direct access to Google Ads or GA4, set the data source credentials to Owner's Credentials. This way, viewers can see the data without needing individual permissions.
Set Up Core Metrics and Visualizations
At the top of your dashboard, include scorecards to display key performance indicators (KPIs) like Total Spend, Total Revenue, ROAS, ROI, and Conversions. These metrics provide a quick snapshot of overall performance. Since ROI isn't always pre-calculated, you can create it as a calculated field using this formula: [(Revenue - Cost) / Cost] * 100.
To track trends, add a time series chart that shows spend and revenue over time. This is especially useful for spotting seasonal changes or performance shifts. Include a table to compare campaign performance by ROI, and use conditional formatting to highlight underperforming campaigns. For example, campaigns with ROI below 150% can be flagged in red.
| Category | Essential Metrics | Description |
|---|---|---|
| Core ROI | ROI, ROAS, Cost, Revenue | Key metrics for profitability and financial health |
| Efficiency | CPA (Cost Per Acquisition), CPC, CTR | Evaluates the cost-effectiveness of actions and clicks |
| Conversions | All Conversions, Conv. Rate, Value per Conversion | Tracks both the volume and quality of user actions |
Once you've added these visualizations, enhance the dashboard's usability by incorporating interactive elements.
Add Filters and Controls for Customization
To make your dashboard more dynamic, add a date range control so users can adjust the reporting period. Include dropdown filters for Campaign Name, Device, and Ad Group, allowing stakeholders to drill down into specific areas of interest. For those managing multiple accounts, a Data Control component can simplify navigation by letting viewers switch between Google Ads accounts without needing separate reports.
Ensure all currency fields are displayed in USD, formatted with commas for thousand separators (e.g., $1,500.00). If you're using an MCC account that deals with multiple currencies, Looker Studio will automatically convert revenue fields to match the currency of the top-level manager account. Note that campaigns or ad groups with zero impressions won't appear in your filter lists or data sources.
Testing, Sharing, and Automating Your Dashboard
Once your dashboard is set up and customized, the next steps involve verifying its accuracy, securely sharing it, and automating reports to streamline your ROI tracking process.
Verify Data Accuracy
Before sharing your dashboard, double-check its data against Google Ads to catch any tracking issues. Compare key metrics like total spend, conversions, and revenue from Google Ads' Insights with the numbers in your Looker Studio dashboard.
Using comparison periods - like the previous month or the same period last year - can help you quickly spot discrepancies. For instance, if your dashboard shows a sudden 200% jump in conversions but Google Ads doesn't reflect the same change, there might be a data connection problem. This step is vital, especially when a HubSpot study from 2024 revealed that 67% of marketers don't track metrics that actually influence business outcomes. By validating your data, you're already ahead of many advertisers.
Focus on 90-day trend lines instead of daily snapshots to identify unusual spikes or potential tracking failures. Break down performance by campaign types - Search, Shopping, and Performance Max - to avoid having blended averages hide issues within specific segments. Also, remember that many businesses overestimate their ROAS by 20% to 40% because they often leave out management costs in their calculations.
Once you're confident in your data's accuracy, move on to setting up secure sharing options.
Set Up Sharing and Access
When sharing your dashboard, stick to the "Invite people" option in Looker Studio instead of "Anyone with the link". This ensures only specific individuals or groups can access the data, as it requires Google authentication. You can add individual email addresses or use a Google Group to manage team access efficiently.
Assign roles based on the user's needs: "Viewer" for those who only need to see the data or "Editor" for team members responsible for maintaining the dashboard. For executives or external stakeholders who don't need direct access, you can use the scheduled email feature to send automated PDF reports. Keep in mind that users with "email-only" access in Google Ads won't be able to view the dashboard directly and will need reports sent via email.
| Sharing Method | Best For | Security Level |
|---|---|---|
| Invite People | Team members & collaborators | High (Requires Google Auth) |
| Scheduled Email | Executives & external partners | Medium (PDF attachment) |
| Link Sharing | Broad internal distribution | Low (If "Anyone with link" is on) |
With access securely managed, you can now automate your reporting workflow for consistent updates.
Automate Scheduled Reports
To automate report delivery, click the schedule email icon on your saved dashboard. Enter recipient email addresses, choose a delivery frequency (daily, weekly, or monthly), and select PDF as the file format. Reports for individual accounts are sent at 1:00 AM in your account's time zone, while manager account (MCC) reports are sent at 5:00 AM.
Leverage dynamic date ranges like "Last 7 days" or "Last 30 days" to ensure reports always reflect the latest performance data. Including a short note in your scheduled email, such as "Weekly ROI performance for Q1 campaigns", can help recipients quickly understand the report's focus. If you manage multiple client accounts through an MCC, you can schedule reports for all accounts or choose specific sub-accounts.
For more advanced automation, try the Google Ads add-on for Google Sheets. This tool allows you to schedule automatic data updates and send email notifications when the spreadsheet refreshes. It's especially useful if you need to run custom calculations or create pivot tables before sharing the data with your team.
Advanced ROI Tracking Techniques
Once your ROI dashboard is up and running, you can take your analysis to the next level by incorporating multi-channel blending and attribution model comparisons. These advanced techniques give you a deeper understanding of how your marketing efforts perform across platforms and attribution strategies.
Blended ROI Across Channels
Running ads on platforms like Google and Facebook? Calculating a blended ROI can provide a more comprehensive view of your overall marketing efficiency. To do this:
- Standardize channel names using a lookup table.
- Combine cost data from all advertising platforms.
- Join this data with GA4 revenue metrics to compute a blended ROAS (Return on Ad Spend). Use the formula:
Total Revenue / Total Costto display blended ROAS.
For more accurate insights, calculate net revenue by subtracting refunds from the purchase value instead of relying on gross sales figures. Additionally, normalize all currencies to USD using daily exchange rates. These steps help you move beyond single-channel analysis and prepare for a deeper dive into attribution modeling.
Attribution Model Comparisons
Comparing different attribution models can refine your understanding of ROI even further. Google Ads provides two primary models: Last Click and Data-Driven. Here's how they differ:
- Last Click: Assigns full credit to the final interaction before conversion.
- Data-Driven: Distributes credit across all touchpoints based on their contribution to the conversion.
To explore these models, navigate to Goals > Measurements > Attribution > Model comparison in Google Ads. Add columns showing conversion value per cost for each model to preview how switching to Data-Driven attribution might impact your ROI. This approach is particularly helpful for identifying undervalued keywords that assist conversions but don’t typically get the final click.
Important Note: Data-Driven attribution requires at least 200 conversions and 2,000 ad interactions within a 30-day period to generate accurate results.
| Attribution Model | Pros | Cons |
|---|---|---|
| Last Click | Easy to understand and implement | Overlooks earlier touchpoints |
| Data-Driven | Accounts for all interactions; more precise | Needs a significant amount of data |
For even deeper insights, use the "Assisted conversions" report to identify campaigns with high assist counts but low last-click conversions. These campaigns might deserve more investment as they play a critical role in driving overall results.
Conclusion
By following this step-by-step guide, you can turn raw data into actionable insights. Creating a Google Ads ROI dashboard isn’t just about crafting eye-catching visuals - it’s about taking control of your advertising budget and making decisions rooted in actual profit rather than superficial metrics. This approach ensures your focus remains on what truly matters: driving profitable, data-informed decisions.
Once your dashboard is set up and automated, its real power lies in enabling proactive decision-making. A well-designed dashboard isn’t just a number-crunching tool. It eliminates the delays associated with monthly PDF reports, allowing you to spot budget surges or conversion tracking issues within 24 hours, instead of waiting weeks to uncover problems. This real-time insight empowers you to shift spending from underperforming campaigns to those that deliver results, preventing unnecessary losses.
"The metric that matters is profit contribution: revenue multiplied by your profit margin, minus total campaign costs (ad spend plus management fees plus all overhead)." - groas.ai
Even small improvements can lead to big results. For instance, each one-point increase in Quality Score can lower your Cost Per Click by about 13%. By keeping a close eye on these trends through your dashboard, you can identify the areas that need optimization. Whether your monthly ad budget is $1,000 or $100,000, the same principles apply: focus on what drives profit, cut out inefficiencies, and scale up what works.
Your dashboard should become the cornerstone of your ad strategy. Keep it updated, let its insights guide your decisions, and use it to refine your campaigns over time. The shift from guessing to understanding your ROI can make all the difference between hoping your ads succeed and proving they deliver measurable growth - the ultimate goal of mastering your advertising spend.
For more expert tips and strategies to optimize your Google Ads campaigns, visit Surfside PPC.
FAQs
Why doesn’t my Google Ads cost or revenue match GA4?
Discrepancies between Google Ads and GA4 happen because they rely on different tracking methods and attribution models. Google Ads prioritizes its own conversion tracking, while GA4 takes a broader view, focusing on the entire user journey and multi-channel attribution.
Revenue tracking differences - like including taxes, shipping costs, or handling refunds - can also lead to mismatches. To minimize confusion, align your definitions and carefully review the attribution models used by both platforms.
How do I calculate true ROI when I have management fees and overhead?
To get a clear picture of your true ROI, you need to factor in management fees and overhead costs - not just ad spend. Start by subtracting these expenses from your total campaign revenue. Then, take the remaining net profit and divide it by the total costs, which include ad spend, management fees, and overhead. This approach provides a more precise ROI calculation, giving you a better understanding of your campaign's profitability.
Can I track ROI across Google Ads and other ad channels in one dashboard?
Yes, it’s possible to track ROI from Google Ads and other ad platforms all in one place. Google Ads lets you build custom dashboards to centralize your campaign data. Additionally, tools like Looker Studio make it easy to connect multiple data sources, including Google Ads, Facebook Ads, and Google Analytics. By combining this data, you can get a clear, unified view of your marketing ROI.
Related Blog Posts
- How To Use Google Ads Data For Inbound Marketing
- Google Ads For Beginners 2026
- Google Ads tutorial
- Google Ads support
0 comments