
Running Google Ads without tracking the correct performance metrics guarantees wasted advertising budget and missed revenue opportunities. Digital marketing requires strict adherence to data analysis. Media buyers must monitor specific Key Performance Indicators (KPIs) to determine exactly how users interact with ad creatives and landing pages. Tracking the right metrics allows advertisers to cut unprofitable keywords, lower acquisition costs, and aggressively scale campaign profitability.
The 5 Core Google Ads Metrics:
- Click-Through Rate (CTR): Measures ad relevance by calculating how frequently users click your ad after seeing it.
- Quality Score: Google's proprietary 1-to-10 rating system evaluating expected CTR, ad relevance, and landing page experience.
- Conversion Rate: Tracks the exact percentage of users who complete a desired action (purchases, phone calls, form submissions) after clicking the ad.
- Cost Per Click (CPC): The financial amount paid for a single ad click, directly influenced by auction competition and Quality Score.
- Return on Ad Spend (ROAS): The ultimate profitability metric, measuring the exact revenue generated for every dollar spent on advertising.
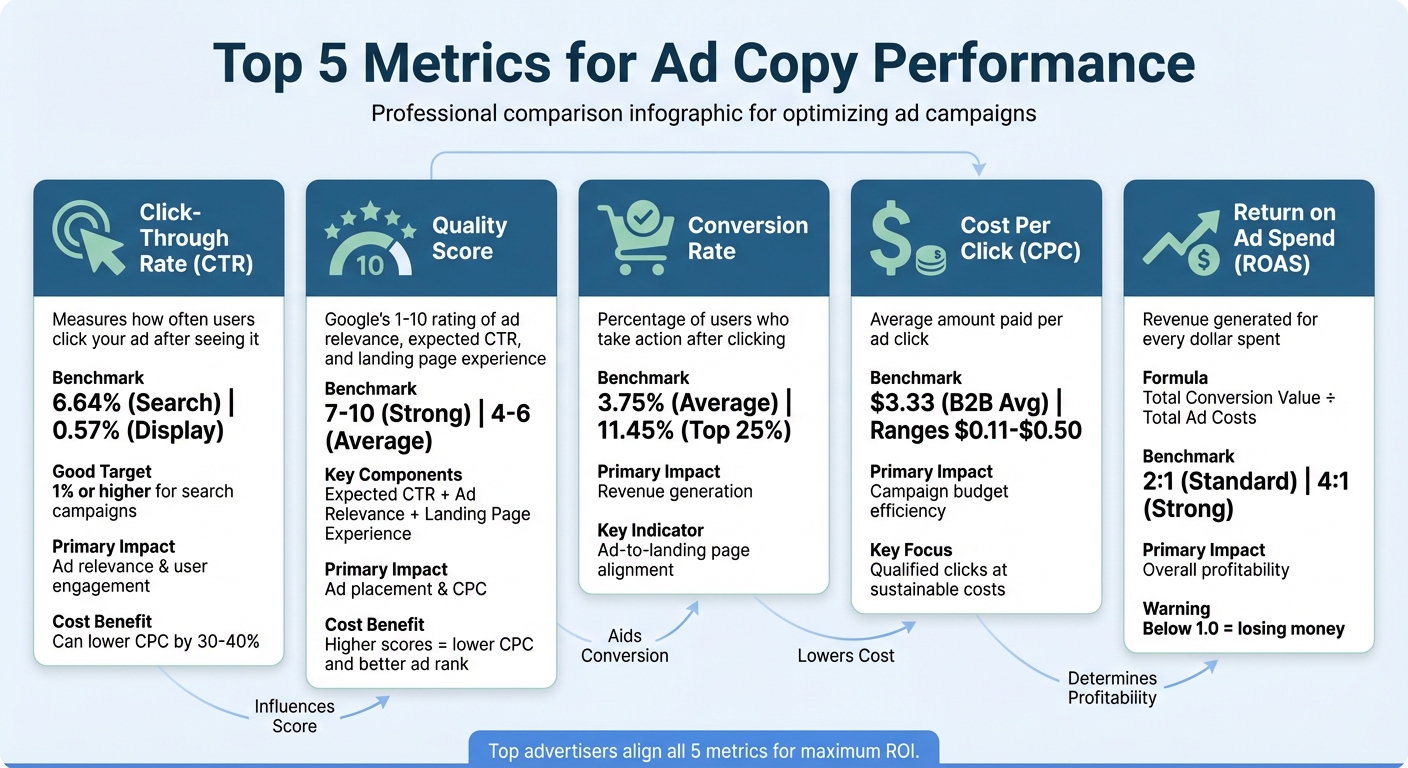
5 Essential Ad Copy Performance Metrics Comparison Chart
What Google Ads Metrics Actually Matter? 5 KPIs You MUST Track
sbb-itb-d8a1e45
1. Click-Through Rate (CTR)
Click-Through Rate (CTR) measures exactly how often people click on your ad after viewing it in the search results. Calculating CTR requires dividing the total number of clicks by the total number of impressions, then multiplying by 100. The global average Google Ads CTR sits at 6.64% for search ads and 0.57% for display network ads. Search campaigns generating a CTR of 1% or lower indicate a severe disconnect between the targeted keywords and the ad copy messaging.
Measuring Relevance to User Intent
A high CTR definitively proves your ad perfectly matches the user's search intent. Capturing the click requires aligning your headline directly with the search query. Failing to achieve a high CTR typically indicates broad, untargeted ad groups or weak copywriting.
"A high CTR is a good indication that users find your ads and listings helpful and relevant." - Google Ads Help
Lowering Campaign Costs with High CTR
CTR directly dictates your campaign costs by heavily influencing your Quality Score. Ads boasting a higher-than-average CTR routinely secure higher Ad Rank placements while paying 30% to 40% less per click than competitors with weak engagement metrics. Maintaining a high CTR forces Google to reward your account with cheaper traffic.
2. Quality Score
Quality Score is Google's diagnostic 1-to-10 rating system evaluating the overall relevance of your ads, keywords, and landing pages. The algorithm grades three specific components: Expected Click-Through Rate, Ad Relevance, and Landing Page Experience. Each component receives a status of "Above Average," "Average," or "Below Average." Elite advertisers maintain Quality Scores between 7 and 10.
Controlling the Google Ad Rank Formula
Quality Score physically controls your position in the auction block. Google calculates Ad Rank by multiplying your Maximum CPC Bid by your Quality Score. Earning a 10/10 Quality Score allows you to physically outrank a competitor who bids significantly more money but possesses a terrible 3/10 Quality Score. Perfecting this metric is the ultimate cheat code for discounted advertising.
Maximizing Ad Relevance and Landing Pages
Achieving a high Quality Score requires flawless Message Match. The keyword searched by the user must appear in the ad headline, and that exact same phrasing must appear on the destination landing page. Utilizing Single Keyword Ad Groups (SKAGs) or tightly themed semantic clusters prevents messaging disconnects and secures "Above Average" relevancy scores.
3. Conversion Rate
Conversion Rate isolates the exact percentage of users who complete a highly valuable action after clicking your advertisement. Generating a high CTR is completely useless if the traffic fails to convert into purchases, phone calls, or qualified lead form submissions. Calculating this metric requires dividing total conversions by total ad clicks.
Evaluating Landing Page Persuasion
A high Conversion Rate validates your landing page architecture. The average cross-industry conversion rate hovers around 3.75%, while elite advertisers routinely exceed 11.45%. Experiencing a high CTR paired with a catastrophic Conversion Rate indicates a severe landing page failure—the ad overpromised, or the page failed to load fast enough for mobile users.
Scaling Profitable Campaigns
Conversion Rate dictates exactly how aggressively you can scale your daily budget. Securing a high conversion rate mathematically justifies increasing your Cost Per Click (CPC) bids, allowing you to dominate the top ad positions without sacrificing net profitability. Continuous A/B testing on landing page headlines and calls-to-action (CTAs) is required to push this metric higher.
4. Cost Per Click (CPC)
Cost Per Click (CPC) represents the exact financial amount you pay Google every single time a user clicks your advertisement. It is calculated by dividing your total ad spend by your total accrued clicks. CPC dictates your volume; a lower CPC allows a fixed daily budget to acquire significantly more traffic.
Balancing CPC with Traffic Quality
Average B2B CPCs sit around $3.33, though highly competitive legal and medical markets frequently exceed $50 per click. While lowering CPC is a primary optimization goal, sacrificing traffic quality for cheap clicks destroys campaigns.
"Lower CPC isn't always better. You want qualified clicks at sustainable costs, not just cheap traffic." - Vrushti Oza, Factors.AI
Executing a rigorous negative keyword strategy eliminates irrelevant, expensive clicks. Combining negative keywords with high Quality Scores forces the Google algorithm to discount your CPC naturally.
5. Return on Ad Spend (ROAS)
Return on Ad Spend (ROAS) is the ultimate executive metric measuring exact campaign profitability. ROAS calculates gross revenue generated for every single dollar invested into the advertising platform. The calculation requires dividing total conversion value (revenue) by total ad spend.
Establishing Baseline ROAS Targets
A 2:1 ROAS (generating $2 for every $1 spent) serves as a baseline survival metric for most e-commerce businesses. Elite campaigns consistently achieve a 4:1 ROAS or higher. Operating a campaign below a 1.0 ROAS means the business is actively losing money on front-end acquisition.
"The higher your ROAS, the better. At the most basic level, ROAS measures the effectiveness of your advertising efforts; the more effectively your advertising messages connect with your prospects, the more revenue you'll earn." - Kyle Taylor, WordStream
Shifting Budgets Based on Revenue
Tracking ROAS allows media buyers to ruthlessly cut losing campaigns. Identifying an ad group generating a 0.5 ROAS dictates immediate budget reallocation toward ad groups generating a 5.0 ROAS. Transitioning away from "Last Click" attribution to "Data-Driven" attribution provides a perfectly accurate view of how early ad interactions contribute to final revenue.
Scaling Metrics with Surfside PPC
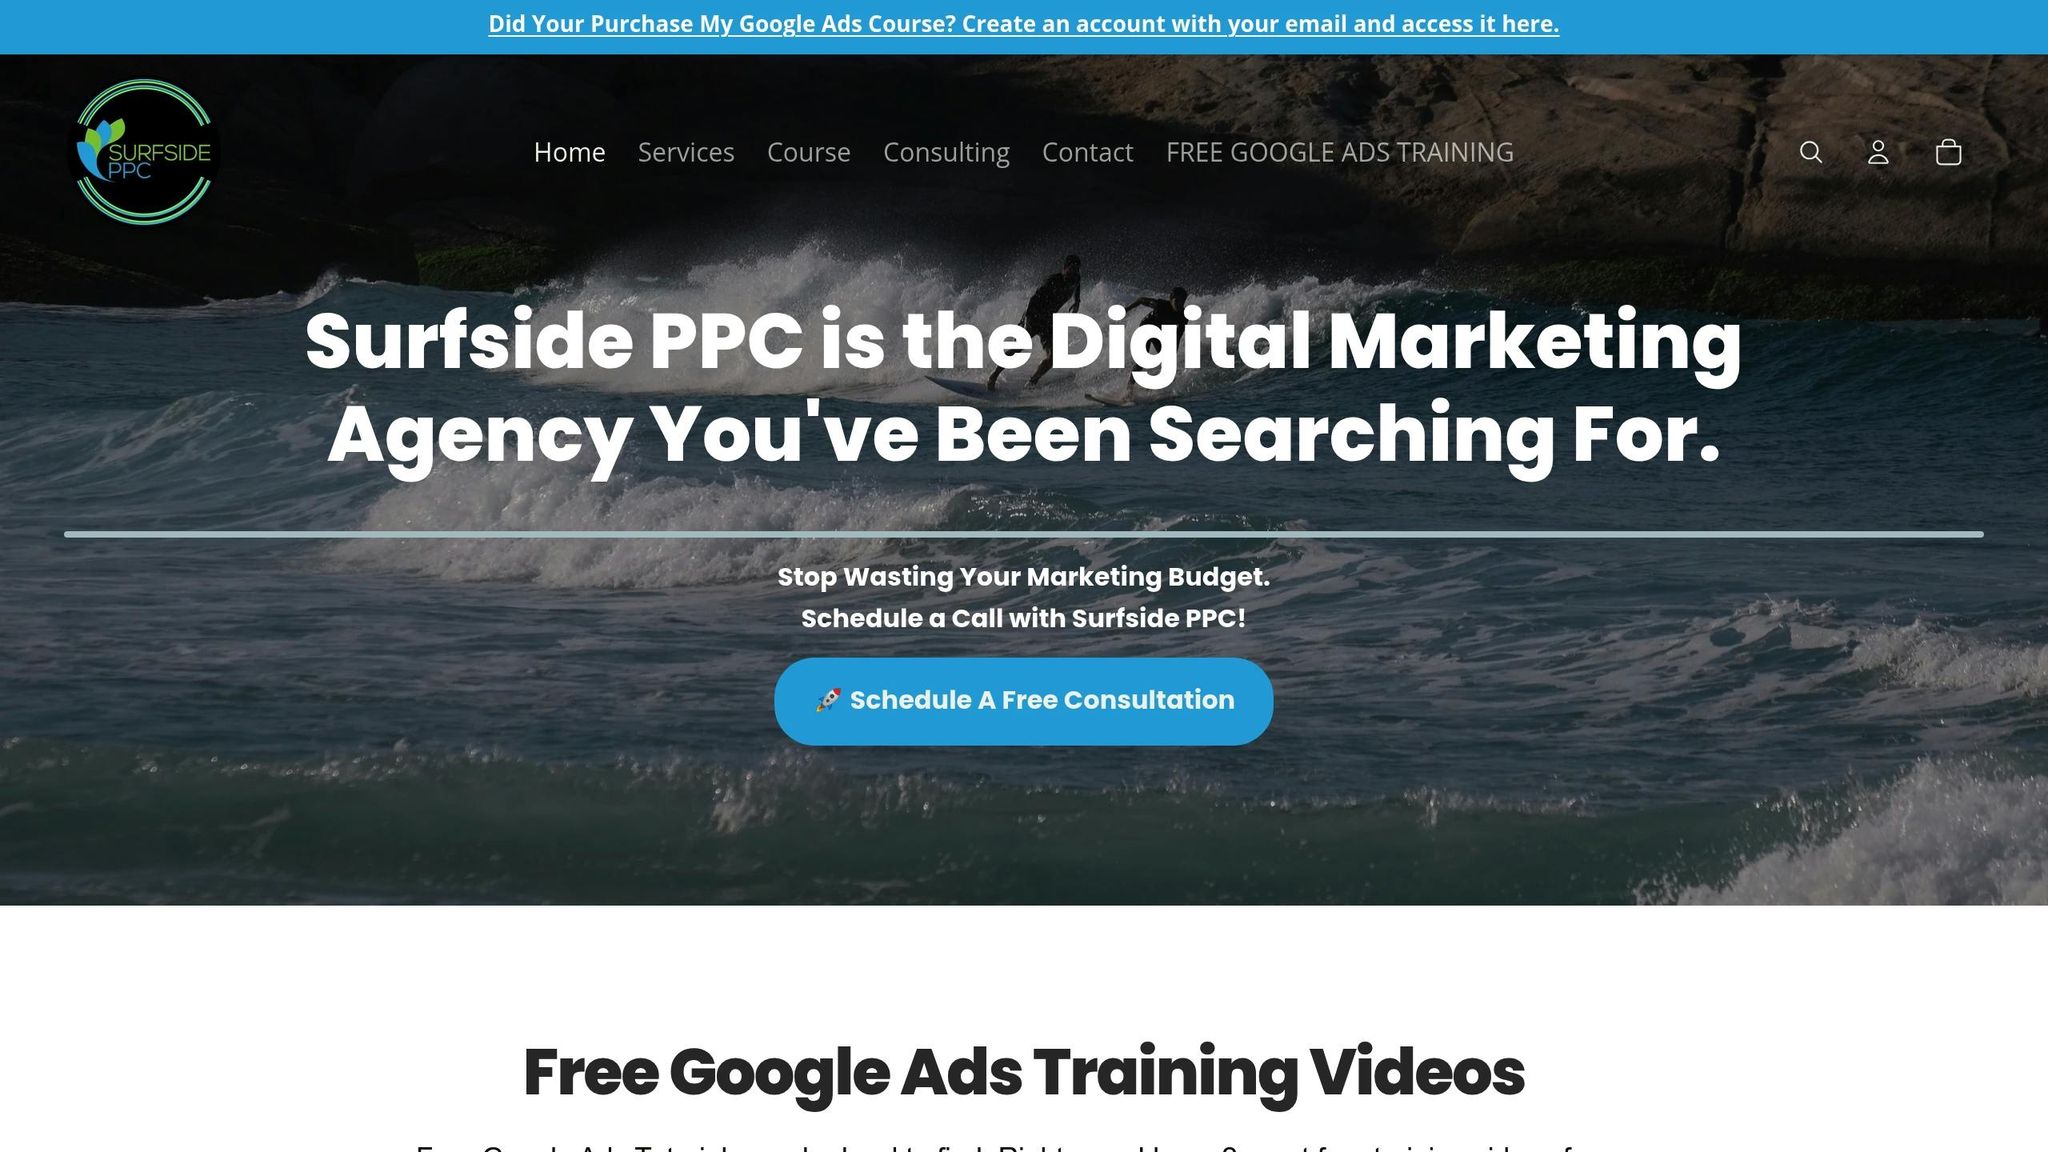
Surfside PPC architects highly profitable Google Ads campaigns explicitly designed to maximize these five core metrics. Our management framework targets Quality Score improvements immediately by enforcing strict alignment between targeted keywords, ad copy, and high-speed landing pages.
We execute rigorous negative keyword auditing and Smart Bidding optimization to aggressively push Return on Ad Spend (ROAS) higher while keeping Cost Per Click (CPC) safely under control. Founder Corey Frankosky personally manages every client account, ensuring a senior-level media buyer analyzes your data.
"I work with all clients at Surfside PPC and I am your main point of contact." - Corey Frankosky, Founder
For independent marketers, Surfside PPC Premium delivers elite video training for just $5/month, covering advanced conversion rate optimization and Meta Ads strategies designed to scale your digital marketing expertise.
Conclusion: The Data-Driven Ecosystem
Tracking CTR, Quality Score, Conversion Rate, CPC, and ROAS transitions digital marketing from a guessing game into a predictable mathematical equation. These five metrics operate as an interconnected ecosystem; improving your CTR elevates your Quality Score, which subsequently lowers your CPC and mathematically increases your overall ROAS.
Advertisers must configure flawless conversion tracking before spending a single dollar. Routine weekly maintenance—including pausing losing ads and updating negative keyword lists—separates profitable enterprise accounts from failing beginner campaigns. Trust the data, optimize the metrics, and scale the revenue.
Google Ads Metrics FAQs
What should I optimize first if my CTR is high but conversions are low?
A high Click-Through Rate paired with a low Conversion Rate indicates a catastrophic landing page failure. You must immediately audit your destination URL to ensure it loads in under 3 seconds on mobile devices. Ensure the landing page headline perfectly matches the promise made in your ad copy, and place a highly visible Call-to-Action (CTA) directly above the fold to remove all user friction.
How can I raise my Quality Score without increasing my bids?
Raising your Quality Score requires optimizing Ad Relevance and Landing Page Experience, neither of which require higher bids. You must write highly targeted ad headlines that include the exact keyword the user searched for. Furthermore, you must structure your campaigns into tight semantic themes so your ads never display for irrelevant queries.
What’s a good ROAS target for my business?
A standard baseline ROAS target is 4:1, meaning you generate $4 in gross revenue for every $1 invested in advertising. However, your true ROAS target depends entirely on your specific profit margins and Cost of Goods Sold (COGS). Businesses with massive profit margins (like software) can sustain a lower ROAS, while physical e-commerce retailers require a much higher ROAS to remain profitable after shipping and manufacturing costs.
| Related Digital Marketing Resources |
|---|
| Common Ad Copy Mistakes in Local PPC Campaigns |
| How to Optimize Story Ads for Meta |
| Comprehensive Google Ads Optimization Guide |
| How to Sync PPC Ads With Email Lists |
0 comments